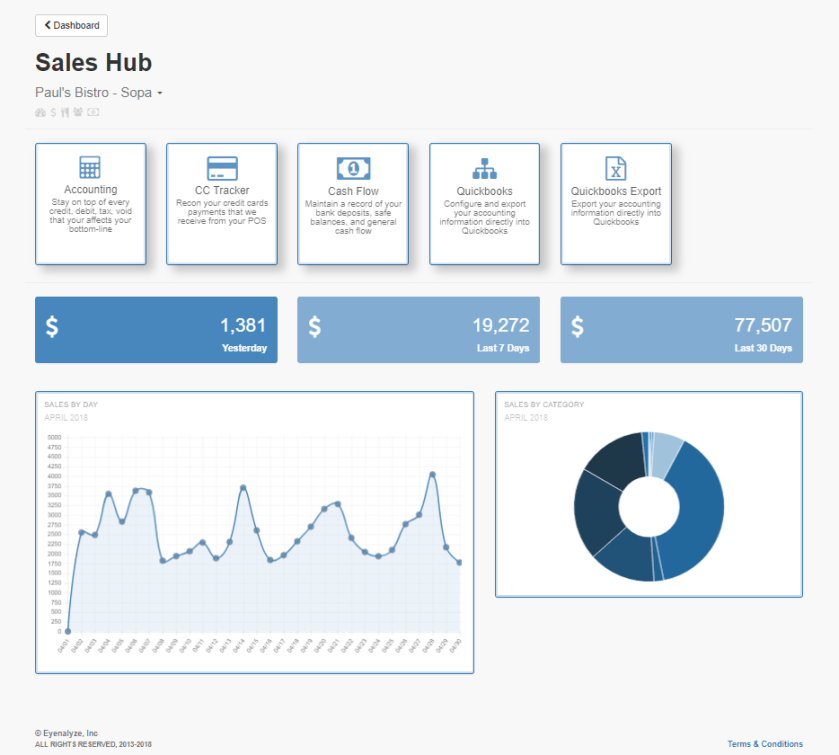
Eyenalyze uses four Hubs to house the various functions needed to manage a restaurant. Each Hub are represented by a color coded tab. Sales is represented by blue, Inventory is yellow, Labor is red, and Profit is green. These colors are consistent throughout the platform.
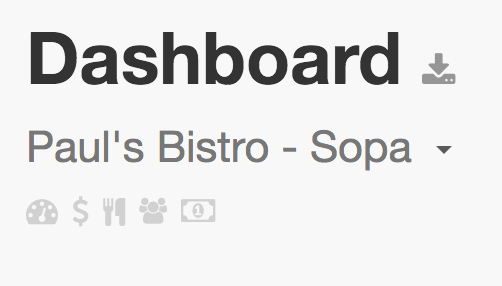
The Dashboard automatically opens up with Sales. Navigating the tabs changes the color and data appearing on the Dashboard. Each Hub has its own personalized set of charts and graphs used to present data for a restaurant. Each Hub also has its own menu of functions, called the Fuse Panel, that can be reached by clicking the header for each Hub.
![]()